As a Haiku Deck Premium subscriber, you have access to analytics data that helps you understand how your presentations are being viewed, by whom, and even get notifications when specific users viewers your material. This is great for keeping track of how customers, prospects, and clients are consuming your presentations.
Please note, we began capturing data for analytics on September 15, 2017. Analytics data from before this date is not available.
Qualifying subscribers will see a new analytics tab on the drop-down menu when they sign in at www.haikudeck.com. Choosing Analytics from this menu will bring you to the Analytics Dashboard.
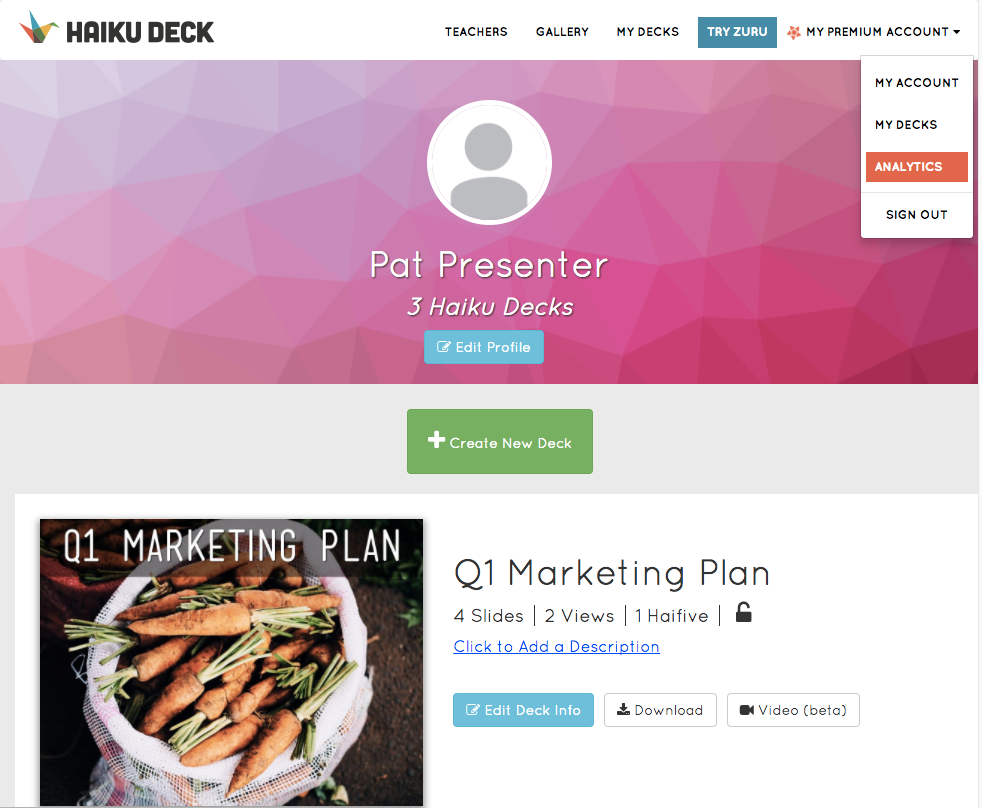
Analytics Dashboard
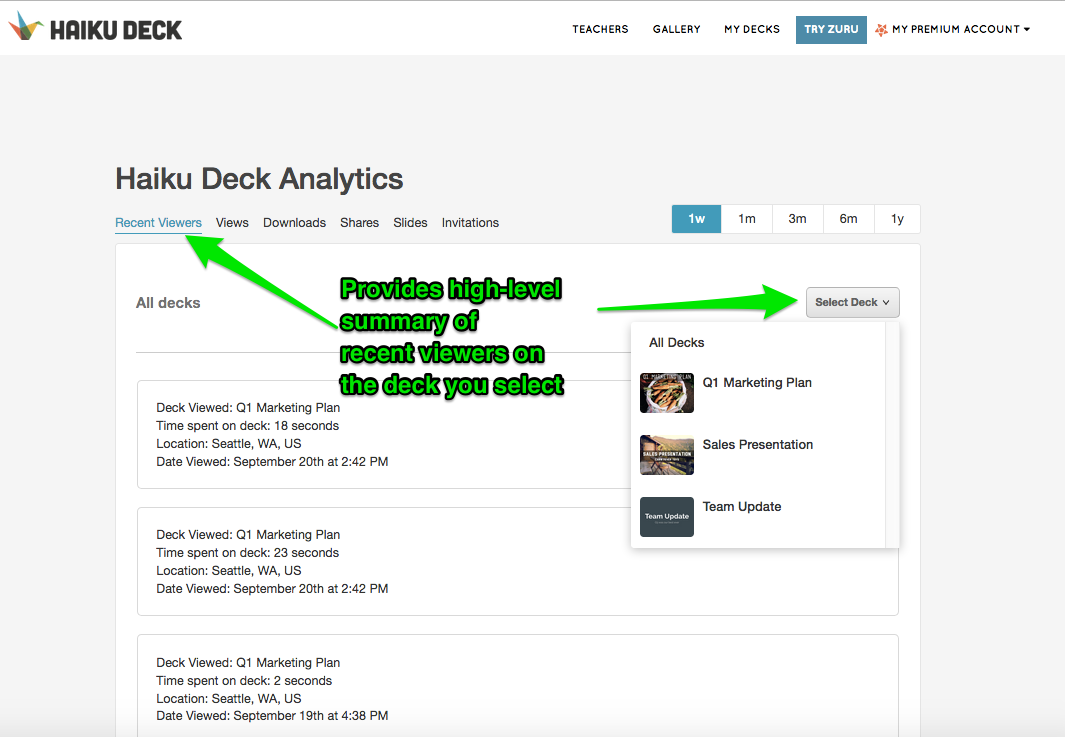
Recent Viewers: Provides high-level information about recent views on the deck chosen from the 'select deck' drop down list. You can also choose to get the summary for all decks. Information provide includes time spent on the deck, the location of the viewer based on their IP address, the date and time of their visit.
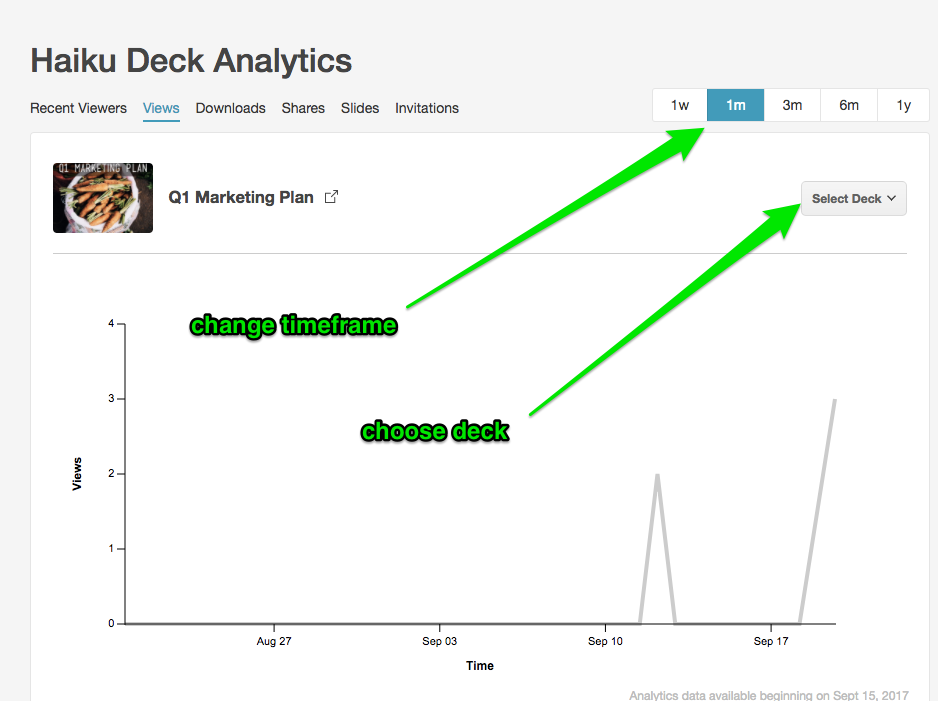
Views: Provides a chart showing the number of views received for the deck chosen. You can also choose to get the views summary for all decks. These stats don’t include the number of times you have viewed your own decks while signed into Haiku Deck or while using the iOS apps to view.

Downloads: Here, you will see a graph of all of the downloads that you deck has received. These stats don’t include the number of times you have downloaded your own decks while signed into this account.
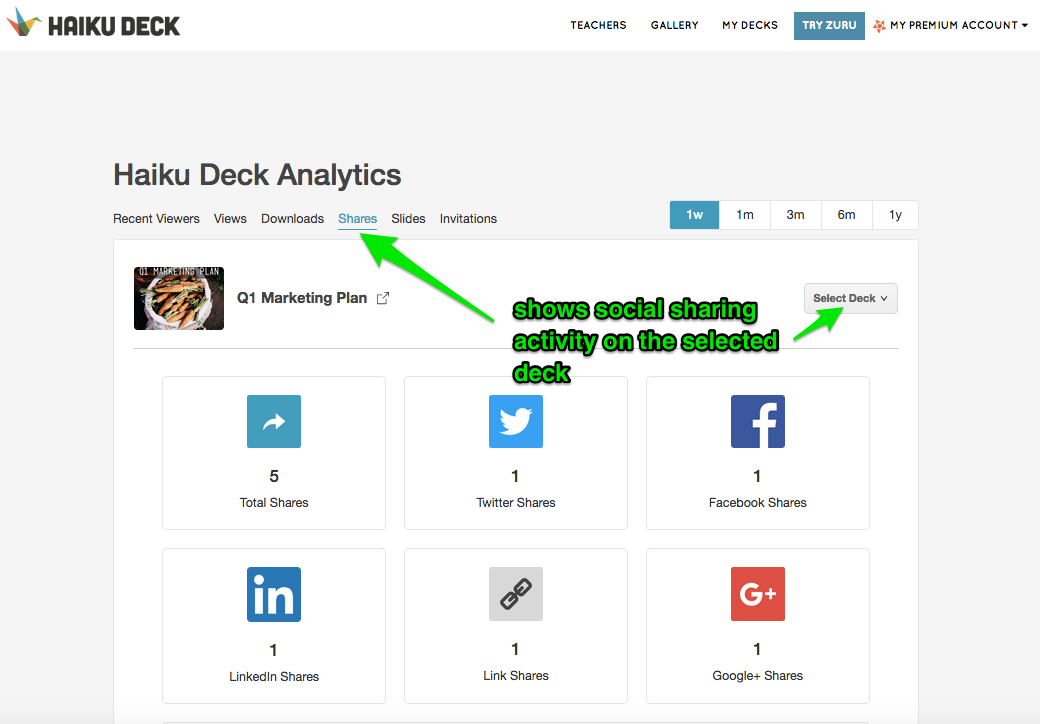
Shares: The Shares tab will show you the number of shares that your decks have received on different social media platforms. Specifically, you will see the number of shares your deck has received on Twitter, Facebook, LinkedIn, Google Plus, Google Classroom, and even link shares. You can see how many shares each deck has received by changing the selected deck.
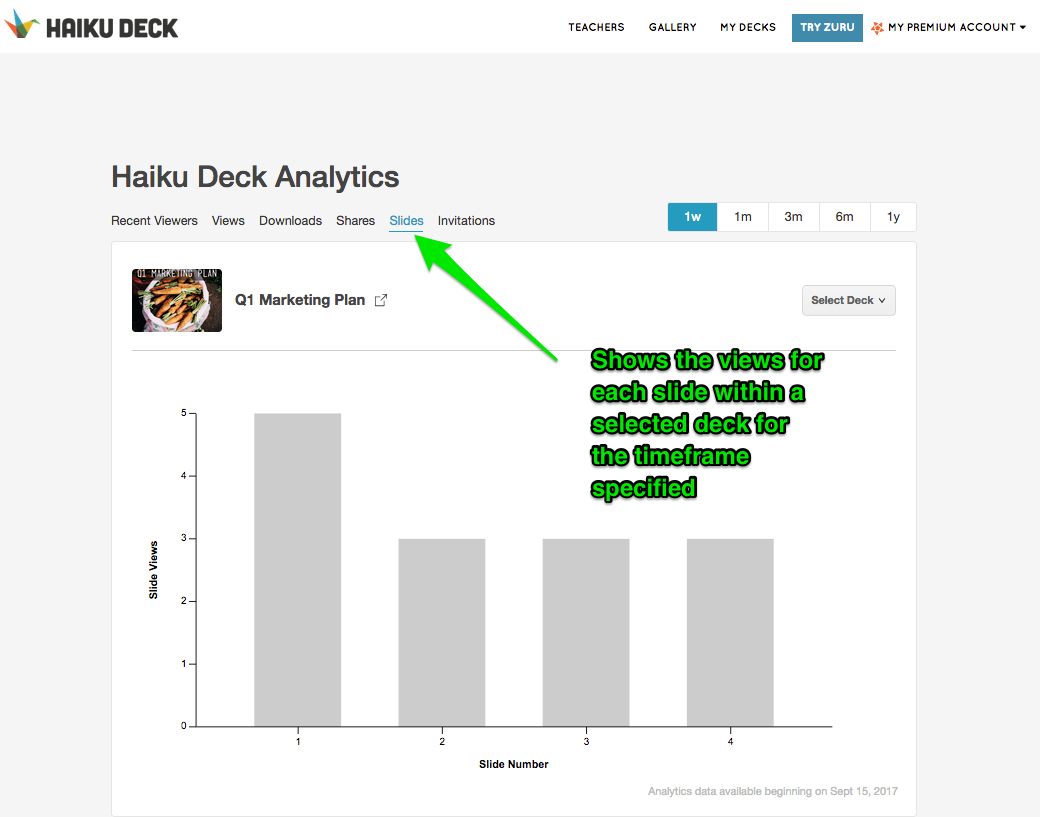
Shares: When no deck is selected, the Slides page will prompt you to select a deck. Once you have selected a deck, you will see the number of views each slide in your deck has received in the form of a bar chart. This helps you understand the way in which your audience is engaging with the specific content of your deck.
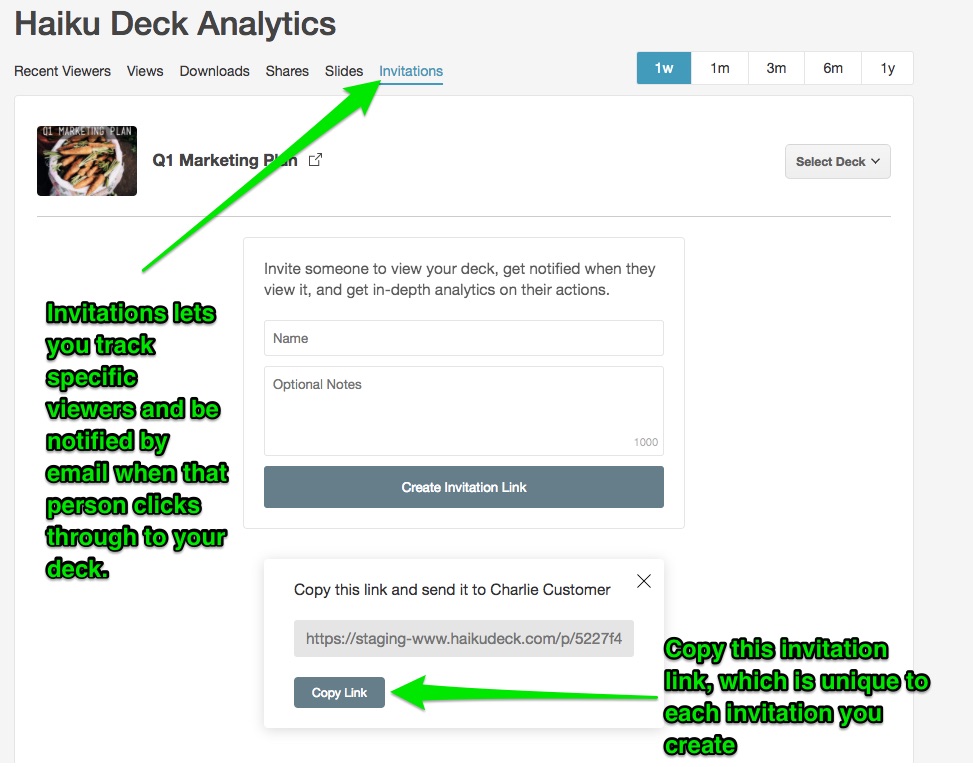
Invitations: Allows you to create a custom link to send to anyone in order to get in-depth analytics based on their actions and email notifications each time they visit your deck. To get started, type in the person’s name and add any notes you want in the box below. This notes field is private and can be used to enter any information about the viewer that you may wish to remember later on. Once you click “Create Invitation Link,” you will be given a unique link. Send this link to the anyone you want. Once that person has viewed the deck, you will received an email telling you when they viewed the deck and their general location.
On the Analytics page, you will see various information such as when the user viewed the deck, how long they spent looking at the deck, and more.
0 Comments